Air Pollution & GDP
Unveiling correlations and the factors that affect us today


Introduction
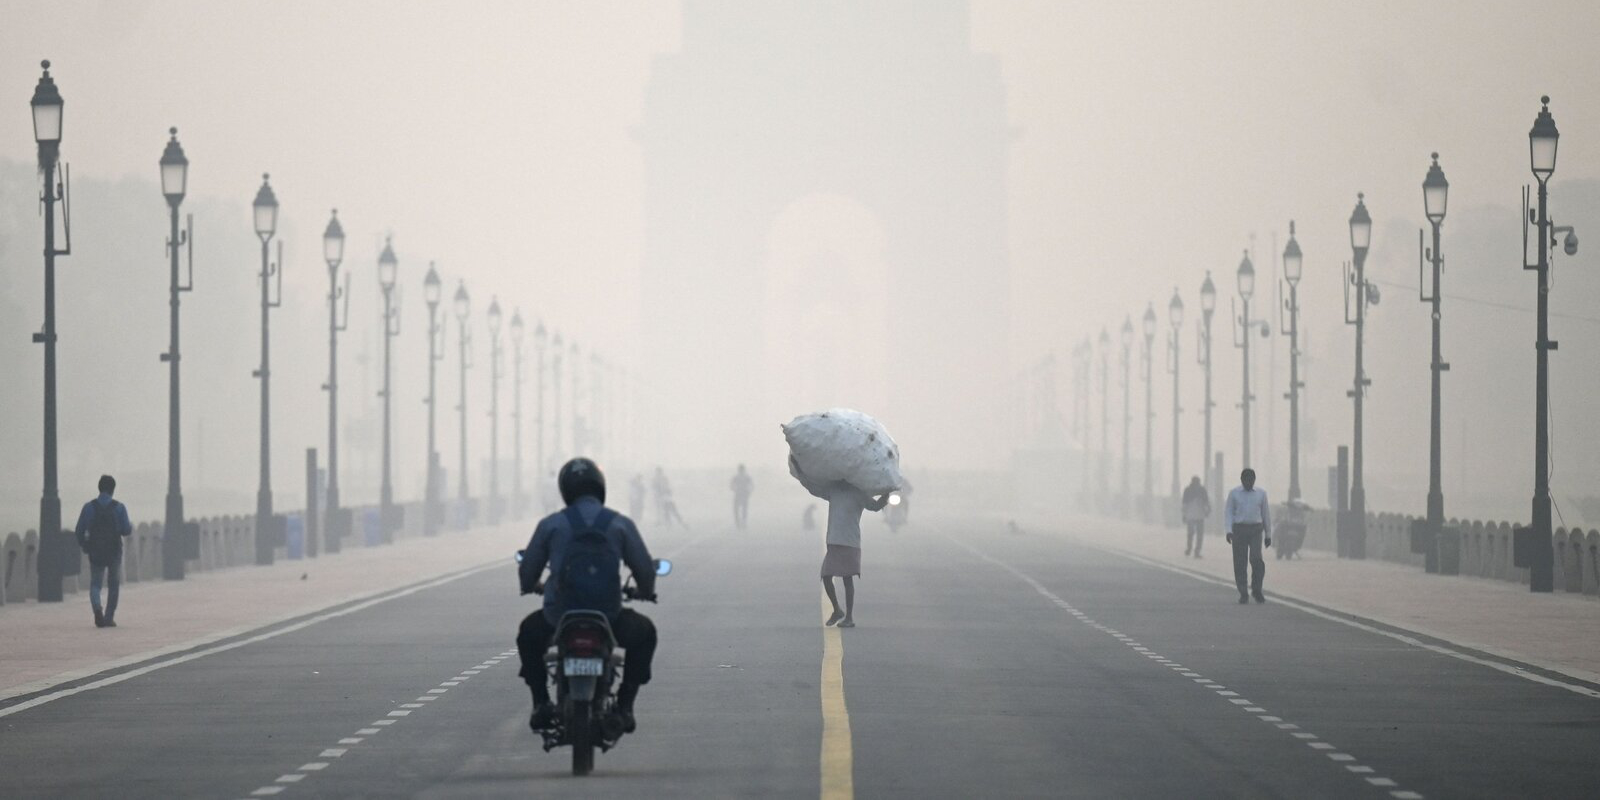
Atmospheric pollutant levels have a large impact on quality of life. Unfortunately, the countries that experience the worst air pollution levels often have the fewest economic means to improve those levels, and often cannot afford to implement environmental regulations that would limit emissions and improve air quality.
By doing this project, we hope that users will gain a deeper understanding of the factors that contribute to air pollution, as well as the countries that suffer from the worst air pollution and GDP to air pollution ratios. The goal is to discover a correlation between economic output as measured by GDP and air pollution and to analyze the different factors that contribute to air pollution. In response to this information, people can live a greener lifestyle or advocate to living a greener lifestyle.
Context
To understand the problem relating to air quality and GDP, we have to first look at all of the countries in general to see their GDP and the amount of particles in the air. The standard of measurement for particles we are using is called fine particulate matter (PM 2.5), where in high amounts of it, can result in harmful to a person's health. The reason that we focus on these particles is because they are able to enter the bloodstream, giving rise to premature death. The graphs below relate the relationship between the amount of particles that exist and the GDP per capita of each country, to see if there is a correlation.
General Visualizations
Air quality of all countries based on PM25 emissions
This data shows the amount of particulate matter in each country, color coding them from lowest to highest using a logarithmic scale. Safety levels for PM 2.5 is anywhere under 12 with no risk at all to exposure. PM 2.5 levels with a concentration above 35 micrograms/meter^3 can cause health issues in a 24 hour period of exposure. As seen in the map, dangerous levels of PM 2.5 are present in many areas of Africa and Asia.
GDP and GDP per capita of all countries based on World Bank data
This graph shows the GDP and GDP per capita of each country on a logharithmic scale. From this graph, it can be observed that countries with the highest GDP are in North America, Australia, and Europe. Countries that are low in GDP are located in Africa and in the middle East, with some countries located in Asia.
From these two graphs of GDP and AQI, it can be concluded is a general correlation between the two. It is seen that GDP does affect AQI and having more fine particles in the air. This relationship can be seen specifically in countries of Africa such as Central African Republic and Kenya, where lower GDP does mean higher AQI. Countries in Europe also show this trend, where because they have more GDP, they air quality is quite low. The countries that are outliers to this relationship are China, India, and other countries in the middle East.
The next section will explore the specifities of what type of pollutants are in the air and relate it to GDP of each country.